

Conversion Funnel Analysis In A Nutshell

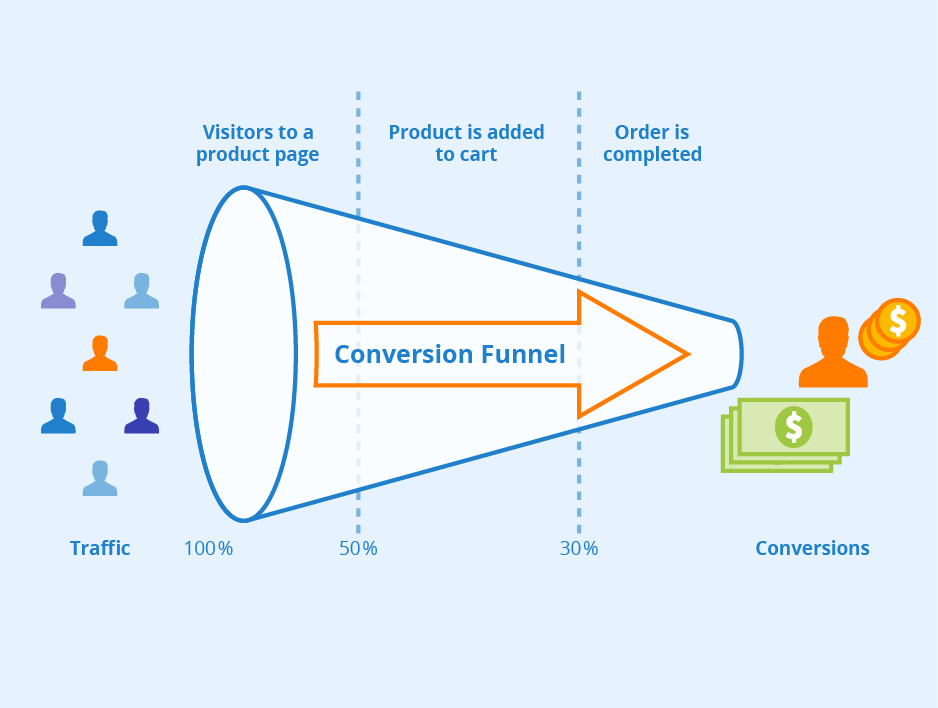
Conversion funnel analysis is the process of examining each step a potential customer takes, from the first contact with your site to completing a purchase. It helps you understand where customers drop off and what might be stopping them from completing a purchase.
In practice, you map out these steps—visiting your homepage, exploring product pages, and checking out—and look for where the flow breaks down. This lets you pinpoint areas where you can improve, such as simplifying the checkout process or improving product descriptions.
How To Analyze Your Conversion Funnel: Step-by-step
In each step, pay close attention to the concepts you need to understand, what you need to do, and the tools you need to learn.
TL;DR

Step 1: Outline the customer journey and mark touchpoints
This stage involves 2 sub-steps:
1.1 Identify Key Stages
Break down the customer journey into clear stages—Awareness, Interest, Decision, and Action. Think about what pulls the customer to the next step. For example:
-
- Awareness: They come across your ad, hear about you on social media, or see your article on search engine results.
-
- Interest: They check out your website or sign up for your newsletter.
-
- Decision: They compare your products, look at reviews, and add items to their cart.
-
- Action: They head to the checkout page and complete their purchase.
Spot where potential customers interact with your brand at each stage. Each touchpoint is a chance to connect and convince them to move forward.
For example, if search results are one of your key traffic sources, make your content a valuable point of awareness. Look at this meal planning template content; it offers more than just the promised templates—it also provides a practical guide on using these templates and a free trial of their meal planning app.
1.2 Use Mapping Tools
Use Miro or Lucidchart to lay out the journey visually with its touchpoints to spot where you need to tweak things. Here’s a conversion funnel analysis example from Lucidchart:

Doing this is easier said than done. If you need help to understand your customer’s journey and to identify their touchpoints, learn these skills from our CRO program.
Step 2: Set up conversion points and observe user behavior
This step involves you mastering how to navigate Google Analytics and Hotjar.
2.1 Set Up Conversion Points in Google Analytics
Here’s where you need to start getting to know Google Analytics a little better. In this stage, you need to set up and track conversion events.
-
- Go to your GA4 property and find the “Admin” gear icon at the bottom left corner.
-
- In the “Data Display” column, click on “Conversions.”
-
- If the event you want to track as a conversion (like form submissions or purchases) has already been collected, you can directly mark it as a conversion. Click “New Conversion Event” and enter the event name exactly as it appears in your event data. If it’s not yet set up, you will need to configure the event via Google Tag Manager or direct code modifications first to capture the interaction.

2.2 Monitor & Analyze User Behavior
With your conversion events established, check the “Conversions” section under “Reports” to observe how users interact with your touchpoints. Identify where users are converting and where potential drop-offs occur.

2.3 Use Event Tracking for Detailed Insights
GA4 automatically tracks interactions as events. If you need to track additional interactions, like button clicks or form engagements not automatically tracked, you can set these up through Google Tag Manager or by modifying your site’s tracking code.
This is useful for checking if your page strikes the right balance with its content or if it becomes too much for your users. Take this listicle detailing 40 products to sell online, categorized by type. Tracking events lets you see whether readers browse the entire list or skip directly to specific categories.
Knowing this, you could rearrange the content to highlight popular categories at the top or even develop separate content for them.
3. Audit conversion rates and identify drop-off points
Pinpoint the areas in your sales funnel that need some fine-tuning to clear out any obstacles and make the user journey smoother. The ultimate goal here is to have a good conversion rate.
Here’s how to approach it:
3.1 Analyze Conversion Rates at Each Conversion Funnel Stage
In GA4, head to the “Explore” section and select the “Funnel exploration” tool. Define the events that mark progression through the funnel: page views, adding items to a cart, or completing a purchase.
GA4 will show you how many users move from one step to the next and the percentage drop-off at each stage. Take note of where the drop-off happens. This will help you understand what needs to be improved, whether it’s a particular page or a step in the user process.

You can work with Invesp for conversion rate audits. We can offer you deeper insights into your funnel’s performance, with detailed analytics and benchmarks against industry standards so you can see what you need to improve more easily.
4. Track engagement patterns
This is where you’ll closely observe how users interact with key features on your site: forms, buttons, and navigation menus.
4.1 Monitor User Interactions
Start by watching how visitors engage with various elements on your site: how they use your forms, which buttons they click, and how they navigate through your menus. You don’t have to manage this by yourself; hire a marketing assistant to monitor these interactions so you can concentrate more on the decision-making aspects. On-the-ground hiring platforms like Genius will source the A-player who can monitor these for you.
4.2 Identify High Engagement & Friction Points
Look for areas where users are highly engaged— buttons that get a lot of clicks or pages where visitors spend a lot of time.
Expert tactic:
If you want your users to stay and interact longer with your page, add several valuable videos. This golf accessory review is an excellent example of that. While they provide their review in written form, the videos make the points more digestible making it more helpful for their readers.

Frequent clicks can either show they are interested or confused if the outcome isn’t clear. Long scrolls or pauses in certain areas could mean that users are either thoroughly enjoying the content or struggling to find what they need. Rapid exits from a page could mean that the content isn’t meeting their expectations or is too complex.
User behavior can mean 1 of 2 things and you want to be clear on this, here’s where the third sub-step comes in.
4.3 Use Heatmaps to Understand User Behavior
FigPii, Hotjar, and Crazy Egg will create heatmaps that show where users click, scroll, and pause the most on your pages. This will help you pinpoint both engagement hotspots and areas where users might be facing usability issues.

Track these patterns to analyze what the interactions mean so that you can tailor your site to make it easier for users to engage where you want them to.
5. Analyze user flows and session recordings
The previous step is to understand how users behave on a specific page, in this step, you will understand how they move through your website.
5.1 Watch Session Recordings
Use FigPii for session replays. These are recordings of individual user sessions on your website that capture everything from clicks and scrolls to typing and navigation. Then, look for routes users usually take. Are they straightforward and efficient, or do users seem to backtrack or get lost?

-
- Notice Hesitation Points: Look for moments where users pause for an unusually long time. This can mean the user doesn’t know what to do next because a button isn’t clearly labeled or the next step in a process isn’t obvious.
-
- Identify Sticking Points: Keep an eye out for places where users repeatedly get stuck. This can be forms that are too long or complex, menus that are hard to navigate, or interactive elements that don’t respond as expected.
-
- Observe Abandonment: Identify where and when users decide to leave your site. High abandonment rates in certain areas usually happen because of slow-loading pages that frustrate users, confusing layouts that make navigating difficult, or a hard-to-use or insecure checkout process.
For example, take a look at this Transparent Labs Whey Protein product page. They place a 10% discount offer in a subtle, small call-to-action at the bottom center of the page. Will users easily see it? Will this product get more sales if the CTA is bigger or situated somewhere else?

Or is it better if they offer the discount like how this golf cart lift kits products page flashed a popup the moment you landed on the site?

Use the insights from these session recordings to pinpoint if your touchpoints are making users act.
6. Segment customers by conversion points
At this stage, you’ve already analyzed your page and website. Now, let’s focus on your visitors. We’ll group them to see which ones convert better.
Here’s how to segment your potential customers:
6.1 Group Customers by Conversion Funnel Stages
Categorize your customers based on the different stages they reach in the sales funnel. Do this by setting up audiences based on their interaction levels:

-
- Users who visited product pages but didn’t add items to their cart (Awareness).
-
- Users who added items to their cart but didn’t proceed to checkout (Interest).
-
- Users who reached the checkout page (Decision).
-
- Users who completed a purchase (Action).
6.2 Analyze the Segments
Next, dive deep into the behavior of each group:
-
- Examine Key Funnel Metrics: Look at session duration, pages visited, and bounce rates. For example, you might discover that users at the Decision stage spend a lot of time on the checkout page, this can mean issues with the payment process.
-
- Identify Conversion Drivers: Determine what actions lead to conversions. This can be interactions with specific content, like watching a product video or engaging with customer reviews.
If any of the 3 stands out as a vital conversion driver, place it prominently on your site’s top fold, like what this medical alert system landing page does. If your product has a specific use like this item, introducing it with a real-life application can quickly showcase its value. Also, if you notice, their video thumbnail is a use-case scenario so even if the reader doesn’t play it they will know how to use it.

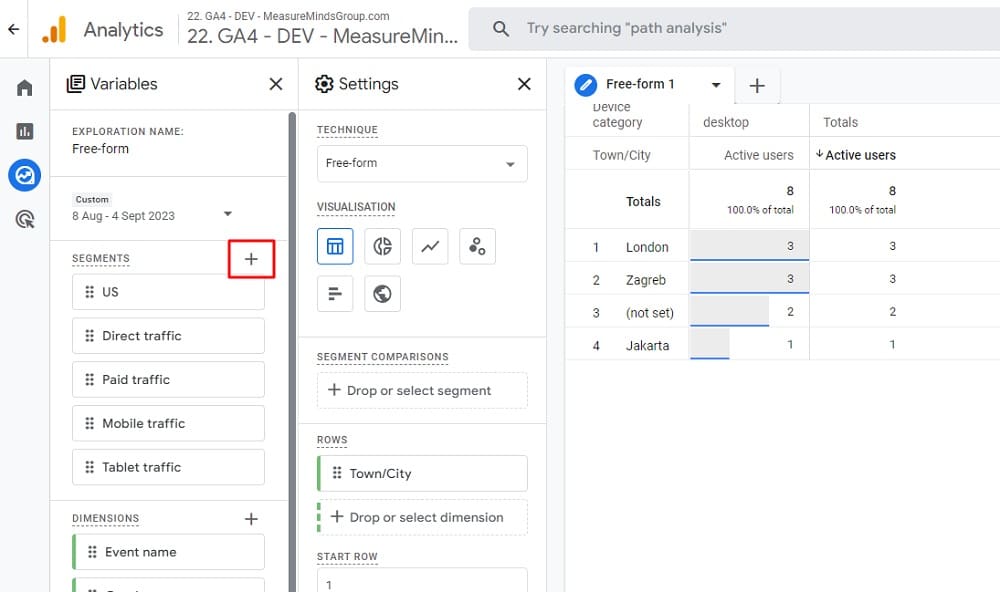
6.3 Draw Comparisons
-
- Compare Behavioral Data: Use the “Compare” feature in Google Analytics to see differences between the segments. This will highlight what effective elements are motivating users to move from one stage to another.
-
- Spot Trends & Patterns: Identify patterns that explain why some users convert while others drop off. Maybe those who convert often visit your FAQ page which suggests that providing more information could help others.
6.4 Apply Insights
Refine your content and processes. If certain content or pages consistently make higher conversions, make them more prominent or accessible to all users.
7. Upgrade UX design elements and test changes to improve the funnel
By now, you’ve gathered enough data to identify where and why users are dropping off. The next is to address these issues. Here’s how:
7.1 Make Design Changes
Use UX design tools like Figma or Sketch to create or refine elements buttons, menus, forms, and page layouts to make them more intuitive and engaging. For example, if you’ve noticed that many users abandon their carts, redesign the checkout process to be simpler and quicker. Remove questions or steps that are causing them to drop off if they are not that important in the buying process.
Here’s a clear example from Deseret Biologicals supplements. After adding products to your cart, instead of taking you directly to checkout, they prompt you to log in—a common drop-off point. If it’s not needed, don’t require it for your users.

Next, do an A/B test to measure how effective the new designs are against the current ones. Use Optimizely or Google Optimize to run tests on different button colors, page layouts, or calls to action to see which versions engage users better or produce more conversions.
Once you have a design that outperforms the original, roll out these changes across your site.
5 Benefits Of Analyzing Your Conversion Funnel
After seeing all the steps in our guide, you might ask if it’s really necessary to dig this deep into your conversion funnel. The answer is yes! Here’s why:
I. Improved Conversion Rates
Analyzing your conversion funnels lets you streamline your checkout process and see fewer cart abandonments. This will improve your conversion rates by up to 35%.
II. Enhanced User Experience
With this analysis, you can design your conversion funnel to solve confusing navigation and slow-loading pages. Users will then like to use your site more, enjoy it, and encourage repeat visits.
III. Increased Return on Investment (ROI)
Analyzing your conversion funnel also makes your landing pages more engaging and targeted. In some cases, you could potentially double your ROI, making every dollar spent more effective.
IV. More Effective Marketing Spend
When you identify which channels and touchpoints engage your users the most, you can allocate your marketing budget more effectively. This will help cut down on waste and improve your campaigns’ performance.
V. Deeper Customer Insights
Analyzing your conversion funnel provides clear insights you can use to align your products and services with your customer’s needs better.


