With the mounting competition, you can’t rely on guesswork anymore to achieve business success. Whether you’re looking to launch new products, optimize marketing campaigns, or enhance user experiences, data-driven decision-making is the secret to staying ahead.
But how can you test ideas, validate assumptions, and implement changes with confidence? The answer lies in an experimentation framework.
It’s like a strategic blueprint that helps you do away with uncertainty, reduce risk, and make informed decisions to drive impactful results.
This article unpacks the what, how, and why of experimentation frameworks. You’ll discover their key components and practical steps to implement them.
What Is an Experimentation Framework?
An experimentation framework is a structured approach organizations use to test ideas, validate assumptions, and make data-driven decisions.
Think of it as a blueprint that guides the planning, running, and systematic analysis of experiments or ideas. Instead of relying on guesses or intuition, it allows teams to explore what works and what doesn’t based on real-world evidence.
The experimentation framework comes in handy, especially when you’re launching a new product, designing a marketing campaign, or improving a website’s user experience. It helps you lessen the risk and make more informed decisions.
Some key components of an experimentation framework include:
- What is your goal? Every experiment starts with a clear objective. For example, if you’re testing a new website feature, your goal might be to increase user sign-ups by 10%.
- Consider the right KPIs (key performance indicators): You need the right metrics to measure success. For instance, if you’re running a marketing campaign, you could measure success with metrics like click-through rates (CTR), conversion rates, or customer acquisition cost (CAC).
- Experimentation: Experiments are the heart of the framework, which includes designing and running tests like A/B testing, multivariate testing, or usability studies. For example, an e-commerce business might test two product page layouts to see which drives more sales.
- Result analysis: After running an experiment, you analyze the data to see what worked, what didn’t, and why. For example, if one version of a landing page outperforms another by 20%, results analysis can reveal the factors that made it successful.
How Does an Experimentation Framework Work?
Step 1: Define the problem or objective.
Defining the problem or objective is like charting a course before a journey. If you don’t know where you’re headed, you’re just wandering. A clearly defined problem sets the tone for your experiment and ensures your team is solving the right thing.
Here’s how to define your objective to create a practical experimentation framework:
- Start with a question. A good starting point is asking, “What challenge are we trying to solve?” And don’t forget to keep it specific. Instead of “How can we get more customers?” ask, “How can we improve our website conversion rate by 20% in 3 months?”
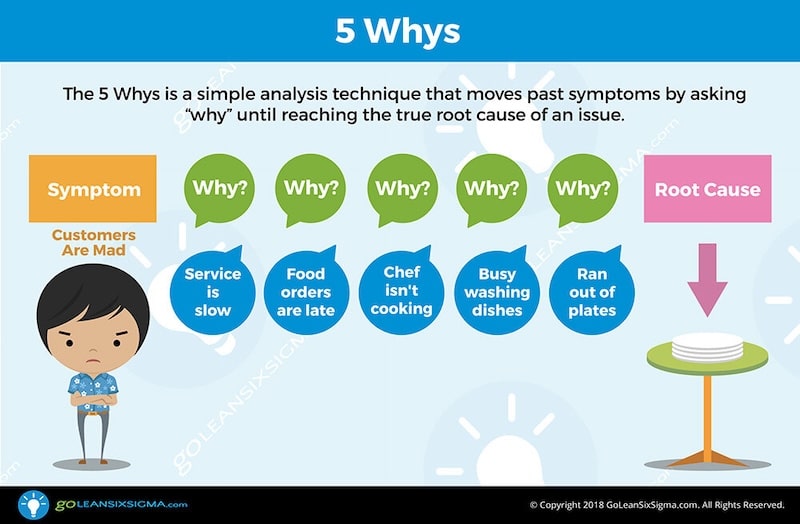
- Look beyond the surface. Sometimes, what seems like the problem is just a symptom. You can take inspiration from Toyota’s famous “5 Whys” technique—which asks why a problem exists repeatedly until the root cause is clear. This technique helped them build a culture of innovation by tackling core issues, not just surface-level fixes.

- Set SMART objectives. Objectives should be Specific, Measurable, Achievable, Relevant, and Time-bound. Instead of saying, “We want more social media engagement,” set a goal like “Increase Instagram story views by 25% in 6 weeks by experimenting with interactive polls.”
Step 2: Formulate hypotheses.
Great innovation starts with a clear, testable hypothesis. It’s the “what if” that sets your experiment in motion.
For the uninitiated, A hypothesis is a specific, educated guess about what you believe will happen when you make a change or take an action. A good hypothesis helps you focus your experiments on measurable outcomes.
Here’s an example to help you understand a bad hypothesis versus a good one.
- Bad hypothesis: “Our website isn’t user-friendly.”
- Good hypothesis: “If we simplify the checkout process by reducing it to two steps, our conversion rate will increase by 15%.”
How will you formulate an adequate hypothesis to set up your experiments? Here are some tips to consider:
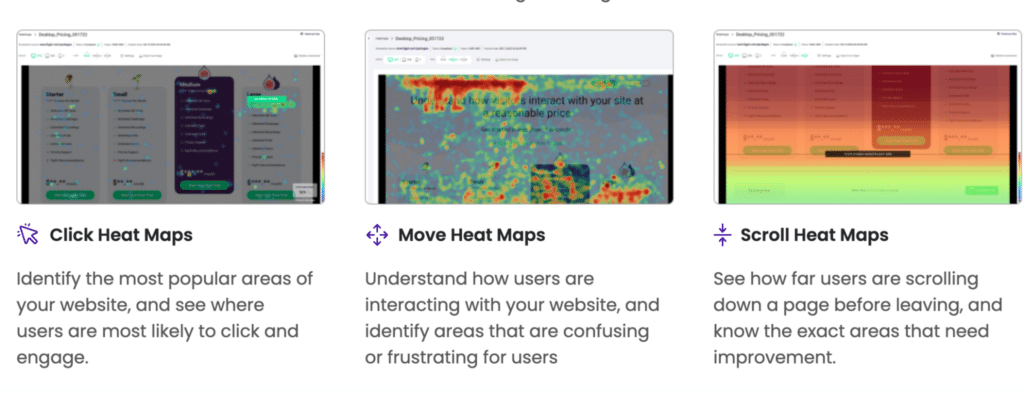
- Start with observations. Collect data, user feedback, or research to identify patterns or problems. Use customer analysis and survey tools like FigPii to gather data on user behavior. For instance, FigPii can track heatmaps to reveal where users are clicking—or not clicking—on your website, helping you identify friction points like abandoned carts or confusing navigation. These valuable insights will be the backbone of your hypothesis.

- Follow the “If-Then” format. Connect the action to the expected outcome. For example, your hypothesis could be: if we send personalized emails to inactive users, then we will increase reactivation rates by 20%
- Tie It to a problem or opportunity. Craft your hypothesis in such a way that it aligns with your overall goals. For example, Tesla’s hypothesis for their car’s model could be: “If we create an affordable electric car with a range of over 200 miles, demand for EVs will double.”
Pro tip: Use tangible data to gather customer insights and formulate your hypothesis. For instance, if you run an ecommerce site, you can track user behavior to hypothesize how minor changes (like adding “Buy Now” buttons) might boost sales.
Step 3: Select the testing methodology.
Your testing methodology determines how reliable, actionable, and impactful your experiment results will be. It’s not just about running a test—it’s about running the right test for your goals.
An effective testing methodology will help you minimize bias, optimize resources, and show you the best results.
Here are some standard testing methodologies to choose from:
- A/B Testing (Split Testing): This involves testing two versions of something (Version A vs. Version B) to see which performs better.
- Best for: Small, specific changes like button colors, headlines, or page layouts.
- Multivariate Testing: This involves testing multiple elements simultaneously to see how they interact.
- Best for: Complex systems, like optimizing an entire landing page.
- Controlled Experiments: This involves testing a hypothesis in a controlled environment where you change only one variable at a time, resulting in accurate results by isolating its impact.
- Best for: Testing one specific change to see its impact, such as tweaking product features, pricing, or marketing strategies. It is ideal for situations where precision and clarity are of utmost importance.
- Usability Testing: It involves observing real users interacting with your product to identify pain points and opportunities.
- Best for: Uncovering friction points in the user experience allows you to make improvements that will make your product more intuitive and enjoyable.
- Exploratory Testing: It’s a flexible, creative approach where testers actively explore a product without predefined scripts or plans.
- Best for: It’s especially useful for uncovering hidden issues or new opportunities during the early development stages when you need to be adaptable and open to unexpected results and changes.
In the end, remember that your methodology should fit the question you’re trying to answer. For example, if your hypothesis is about conversion rate, implementing A/B testing will be ideal. If it’s about user behavior, usability testing works better.
Step 4: Design and execute experiments.
Now comes one of the most important parts of the experimentation framework—designing and executing experiments. It helps you create a structured approach to test your ideas in real-world conditions and get the correct data to make informed decisions.
This process helps you make evidence-based decisions to drive growth, improve user experience, and minimize costly mistakes. The real value comes from how well you plan the experiment and how you manage its execution.
Before you execute the experiments, here’s a list of components you’ll need to design it:
- Define the variables:
- Independent Variable: What you’re changing (e.g., new website design, new product features).
- Dependent Variable: What you measure (e.g., user engagement, conversion rate).
- Create clear goals and metrics: Set clear, measurable goals before you start testing. For example, a company like Netflix could set the goal to improve engagement through its recommendation engine by 10%. They can then measure success by tracking viewing hours per user.
- Use control groups: A control group is essential when you’re testing a change because it helps you compare the results of your experiment to what would happen without the change. It allows you to isolate the effect of the change itself and ensure that any differences you observe are genuinely due to the change and not some other factor.
- Example: Let’s say you’re testing a new teaching method—one group learns with the new method, and the other sticks with the old one. By comparing their results, you can determine if the new method truly made a difference.
Sample size and statistical significance: Ensure you’re testing on a large enough sample size to draw meaningful conclusions. A small test group might give you early insights, but a larger one is needed to confirm the findings. You can use online calculators to determine the optimum sample size and get statistically significant results.

Now, it’s time to execute the experiment. Here’s a detailed breakdown of how to execute your experiment:
Run the test in real-world conditions:
When conducting experiments, ensure your environment resembles actual usage scenarios to make the results meaningful. Real-world conditions will reveal how users genuinely interact with a product, service, or feature, providing insights you can trust.
On the other hand, testing in artificial conditions (like a lab or sandbox) might not capture the nuances of user behavior. For example, a website feature tested only in an employee environment may not consider customer device variations, bandwidth limitations, or diverse interaction patterns.
Monitor and adjust during the experiment:
A critical part of experimentation is monitoring progress in real time. Monitoring lets you identify trends, spot anomalies, and adjust when necessary.
Why does it matter? Experiments rarely go exactly as planned. Monitoring helps you stay agile. For instance, if a change causes unexpected user churn, you can halt the experiment or pivot to avoid losses.
Here are some quick tips to consider while monitoring your experiments:
- Use dashboards and analytics tools like Google Analytics, Tableau, or Looker to visualize key metrics.
- Set alerts for significant deviations, like a drop in conversion rates or page load times.
- Use A/B testing platforms like FigPii to check which offers built-in real-time analytics.
Document everything:
Proper documentation makes troubleshooting, replicating, or sharing findings easier across teams.
Here’s everything you should document:
- Design: Clearly outline the hypothesis, variables, sample size, and testing conditions.
- Setup: Note technical details like software used, configurations, and any challenges during implementation.
- Results: Include raw data, visualizations, and key takeaways.
Pro tip: Use shared tools like Notion, Confluence, or Google Docs to keep documentation centralized and accessible. Ensure that key stakeholders contribute to and review these records.
Step 5: Collect and analyze data.
Without good data, your experiment is just guesswork. This final step ensures your conclusions are based on evidence rather than assumptions. When done well, it helps you identify trends, refine your strategies, and scale successful experiments.
It starts by setting up tools to collect accurate data. For instance:
- Google Analytics for web traffic
- Tableau for data visualization
- Or A/B testing platforms like FigPii.
Whichever tool you use, it should align with your goals. If you’re testing user engagement, use heatmap tools like FigPii to track behavior.
And make sure you view and analyze data objectively. This means looking for patterns and trends and examining your data to see if any consistent behaviors, results, or relationships emerge. These patterns help confirm or refute your hypothesis.
How will you do it? It’s pretty simple. You simply have to analyze key metrics and visualize the data using graphs, heatmaps, or statistical tools to identify trends. For example, if you’re testing a new landing page, track metrics like conversion rates or time spent on the page.
Pro tip: Use charts, graphs, and dashboards to make data understandable. Tools like Tableau can simplify complex datasets.
Wrapping it Up!
Ever wonder how the most successful businesses make smarter decisions? They don’t guess—they experiment. By using an experimentation framework, you can take the guesswork out of your strategies and make data-driven choices that work.
From setting clear goals to analyzing results, each step of the framework helps you reduce risk, improve outcomes, and keep innovating. Businesses that experiment and learn quickly are the ones that stay ahead, leading to continuous improvement and user satisfaction.


