As you focus on increasing your online conversions, you will have to spend time digging through and analyzing your analytics data. CRO is about looking at different Google Analytics metrics and putting them together to determine which pages to optimize and which hypothesis to pursue.
Let’s take a look together at some of the central features of your website data.
In this chapter, we explain the entrance, bounce rate, exit rate, average time on page, and traffic sources. Learn how to differentiate between bounce and exit rates, and find out how to interpret the behavior of your traffic segments.
This data will give you accurate directions to take on your site’s conversion optimization. Remember, conversion rate optimization is about looking at different metrics and putting them together to determine which pages to optimize and which hypothesis to pursue.
As we have mentioned before, while we have no preference for any of the analytics programs available on the market, we do recommend you use two different programs when tracking your website. Some web analytics software you might consider are Google Analytics, Clicky, and Omniture.
1. What Is An Entrance?
An entrance is an event of a visitor entering a website from an external source. Among the several terms associated with an entrance event, you can find “entrance page,” “entrance source,” and “entrance keyword.”
- Entrance page or landing page is the first page a visitor lands on when he enters a website.
- Entrance source is the source of traffic that drives a visitor to the website, either a paid campaign, organic search result, social media, or any other type of external source.
- Entrance keyword is the keyword the user searches for organically or in PPC before he clicks on a website. This keyword is critical in determining the visitor intent which directly impacts the decision to stay on the website or leave.
In October of 2011, Google announced that search data would be encrypted via SSL for logged users to Google (personal accounts on Google). This HTTPS query protects your personal search data from getting abused by third parties. While this protected users, there was a secondary impact of this decision. Google itself could no longer see this data, so it would not be able to report on it. That meant a good percentage of the keyword data would disappear from analytics reporting. While Google estimated that this would impact only 10% of the queries, most webmasters reported that up to 60% of the searches did not provide keyword data.
You can see the keyword data at a landing page level in Google Analytics by going to Behavior and selecting the Landing Pages report. From there, click on any of your top landing pages.

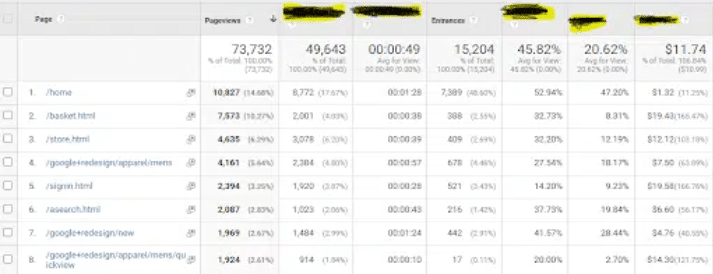
Here’s an example of entrances in Google Analytics;
2. What Is A Bounce Rate?
Bounce rate is the percentage of visitors who enter the website at a landing page but leave it without ever navigating to a 2nd page on the site. Google Analytics defines bounce rates as:
Bounce rate is the percentage of single-page visits or visits in which the person left your site from the entrance (landing) page. Use this metric to measure visit quality – a high bounce rate generally indicates that site entrance pages aren’t relevant to your visitors. The more compelling your landing pages, the more visitors will stay on your site and convert. You can minimize bounce rates by tailoring landing pages to each keyword and ad that you run. Landing pages should provide the information and services that were promised in the ad copy.
Based on this definition, the bounce rate is calculated as follows:
Bounce rate = Number of single page visits / Total number of entrances to that page
Analytics software reports the bounce rate for single pages as well as website average, usually calculated by averaging the bounce rate for all pages of the site. High bounce rates (more than 50 to 60%) indicate a problem in your online marketing. Assuming that your website performance is not an issue, then visitors are leaving your website because the landing page is not providing the information they need. In this case, you need to assess:
- Messaging on the source of traffic
- Continuity of messaging on the landing page
- Page relevancy to the search term
A word of caution here! Website bounce rate can be misleading most of the time. Taking an average bounce rate of thousands of pages is too generic to measure the health of your website.
How do you use bounce rate in optimizing your website?
You can choose between two approaches when using bounce rate for CRO:
1st Approach:
Focus on pages with bounce rate higher than the website average bounce rate. For example, if a website has an average bounce rate of 52%, pages with a bounce rate higher than that should be considered first for optimization. We do not like nor recommend this approach.
2nd Approach:
Establish a mark for the highest adequate bounce rate on each type of page. Evaluate pages with a bounce rate above this mark.
- For the home page of a website, we assess bounce rates above 40%.
- On a lead generation website, we focus on pages with a bounce rate of 30% or higher.
- In an e-commerce website, we look at category pages with a bounce rate higher than 20%.
Take into account that optimizing pages with high bounce rates only makes sense if these pages receive a large number of visitors. Optimizing a landing page that has a bounce rate of 80% will not make any sense if that page only gets 100 entrances per month. We recommend the following guidelines:
- With smaller websites, focus on pages with a high bounce rate if they receive a minimum of 1,000 entrances to that particular page.
- With mid to large websites, focus on pages with a high bounce rate if they receive a minimum of 10,000 entrances to that particular page.
To find the bounce rate overview of your website, or specific pages, go to reports, click on behavior, then click on overview. You’ll see the overview of your website’s bounce rate, average time on page, exit rate, etc.
If you want a specific bounce rate for a particular page, you can click on it below, or you go to behavior again, click on site content, click on landing pages, then you’ll see every page on your site and you can find out the bounce rate for a particular landing page.
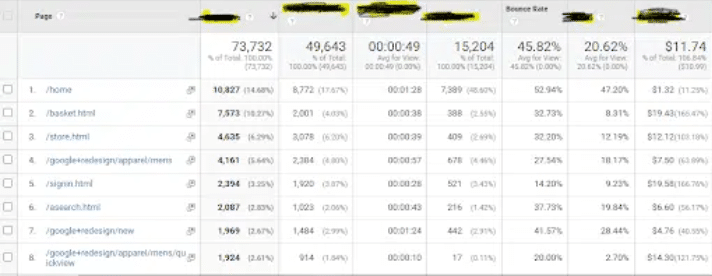
Here’s an example of bounce rate in Google Analytics;
3. What Is An Exit Rate?
Exit rate is the percentage of visitors who leave a website from a particular page after visiting, at least, one other page of the site.
This theoretical definition does not always coincide with how analytics programs calculate and display exit rate.
Google Analytics, for example, uses the following formula to calculate the exit rate on a page:
Single page exit rate = Number of page exits / Number of page views
The number of page views used in the formula includes single page visits. By doing so, exit rate as displayed in Google includes bounce rate.
You might be tempted to start optimization by picking pages with exit rates higher than the site average.
A better approach, however, is first to establish a standard acceptable exit rate for different pages on the site based on their function. Then, select for optimization only the pages that meet the following criteria:
- Pages exit rate is higher than the established acceptable exit rate based on the type of page.
- The number of unique page views is higher than x [where x is dependent on the size of the site]
For some websites, x is 500 page views, for others x is 50,000 page views.
To find the exit rate overview of your website, or specific pages, go to reports, click on behavior, then click on overview. You’ll see the overview of your website’s exit rate.
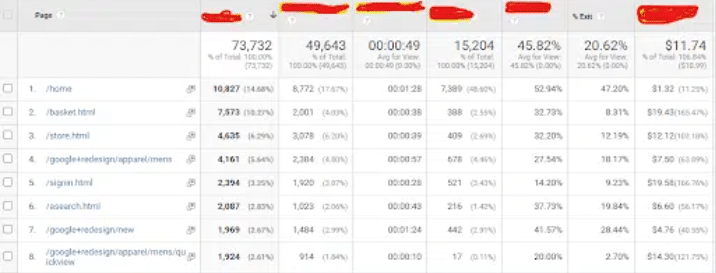
Here’s an example of the exit rate in Google Analytics;
4. What Is The Difference Between Bounce And Exit Rate?
Bounce and exit rates might sound similar to each other, but they measure different visitor behaviors on a website. Bounce rate deals with a visitor’s first impressions of a website. It measures the effectiveness of a landing page design and copy to persuade visitors to remain on the site and take a particular action on the landing page. Exit rate, on the other hand, is used to detect breakdowns in process flow in the website.
In simpler terms, a bounce rate refers to the first page a visitor enters and then leaves the site.
An exit rate refers to the last page a visitor visits before he leaves the site.
Here’s a visual to drive home the point.
Bounce Rate;

Exit Rate;

5. What Is the Average Time On a Page?
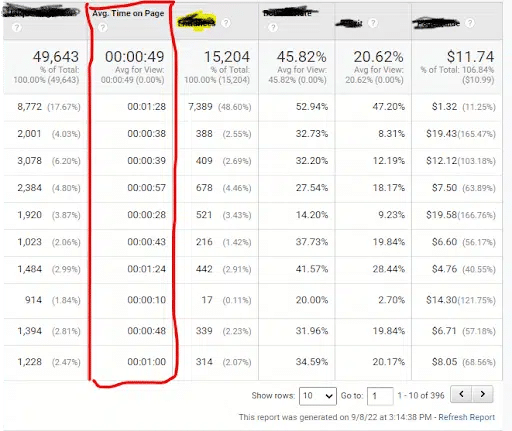
Average time on page calculates how long, on average, visitors stay on a particular page. Of course, you want to see visitors spend more time per visit on your site. In most cases, more time equals more interest and a higher chance of a conversion.
To find the average time on page overview of your website, or specific pages, go to reports, click on behavior, then click on overview. You’ll see the overview of your website’s average time on page.
6. What Are Traffic Sources?
Websites receive visitors either directly, through search engines, or via referring websites. Each of these sources drives unique quality of visitors based on specific products or services. The breakdown of the traffic between the several sources varies for each website. The following figure shows how different sources of traffic drive disparate percentages of visitors to particular websites.

How different sources of traffic drive different % of visitors to the website
While we have been speaking of conversion rates in general terms here, we rarely do that on our projects.
At a minimum, conversion rates should be tracked at the level of the different sources of traffic. General and un-segmented conversion rates do not tell us a whole lot about how well a website is performing.
Typically, the breakdown of conversion rates based on the traffic source shows a higher conversion rate of direct traffic compared to referring websites or search engines. Direct visitors already recognize the brand, thus having a higher chance of converting.
7. Putting Google Analytics Metrics Together To Determine Optimization

- For each of your site’s traffic sources, examine how well the traffic converts. Sometimes traffic from Google converts better than traffic from Bing. If traffic from a search engine converts better than others, it might be worthwhile to increase PPC spending with that engine. But that is not enough.
- Also, examine the average time visitors spend on your site based on the traffic source. Remember that a higher average time means higher interest and a higher chance of conversion. If visitors from Google spend twice as much time as visitors from Yahoo, probably they are more interested in your product or service.
- Next, examine the bounce rates for each of your site traffic sources. Higher bounce rates for a source of traffic compared to other sources means that your landing page does not match the type of customers coming from that source.
- The following step is to ask yourself why there is a difference in conversion rates among the traffic sources. Are visitors using different keywords to get to your website from these different engines? Is your ranking different in search results? Analyze and determine why traffic from one source converts better compared to another source. After you come up with some possible reasons, assess what you can do to increase conversions for each of the different traffic sources.
Let’s examine the following example:
| Yahoo | Bing | ||
| Conversion rate | 1.2% | 2.3% | 0.4% |
| Average time on site | 7:33 | 9:12 | 12:01 |
| Bounce rate | 22% | 26% | 39% |
In this example, Bing is the worst engine for converting traffic. Most companies would decide not to spend any money on PPC if they see this data.
However, you should also examine the average time a visitor from Bing spends on the site. You will notice that Bing visitors spend significantly more time on the site. But why aren’t they converting? Somehow the site is not giving visitors from Bing what they are looking for, but these visitors are still willing to spend the time.
Also, notice that Bing has the highest bounce rate. That means spontaneous visitors from Bing are not able to find what they are looking for immediately after landing on the site, in contrast to visitors from Yahoo and Google.
8. Evaluating A Homepage Using Key Metrics
You can check in the video below the use of web analytics for evaluating a homepage. During one of our webinars, we explain the key metrics and how their data help you decide on your CRO focus.
Watch below as we talk about typical bounce rates and exit rates, page value, and percentage of page views. Learn how to cross references when assessing the pages of your website for conversion optimization.
Video – Evaluating Your Homepage For Conversion Rate Optimization by Invesp
Additional Resources
7 Little Known Tips to Cut Down Your Bounce Rate
Landing Page Optimization Tactics For Different Sources Of Traffic
How To Convert Different Types Of Visitors On Your Website
Landing Page Optimization Checklist: What To Do When Your Landing Pages Are Underperforming


