
The US mobile commerce industry is growing. Check out this infographic to know the latest US M-commerce retail sales statistics, along with why consumers prefer mobile shopping, and how much time consumers spend on mobile shopping and much more.
Infographic by- Invesp
To Publish this Image on your Blog or Website . Copy this code
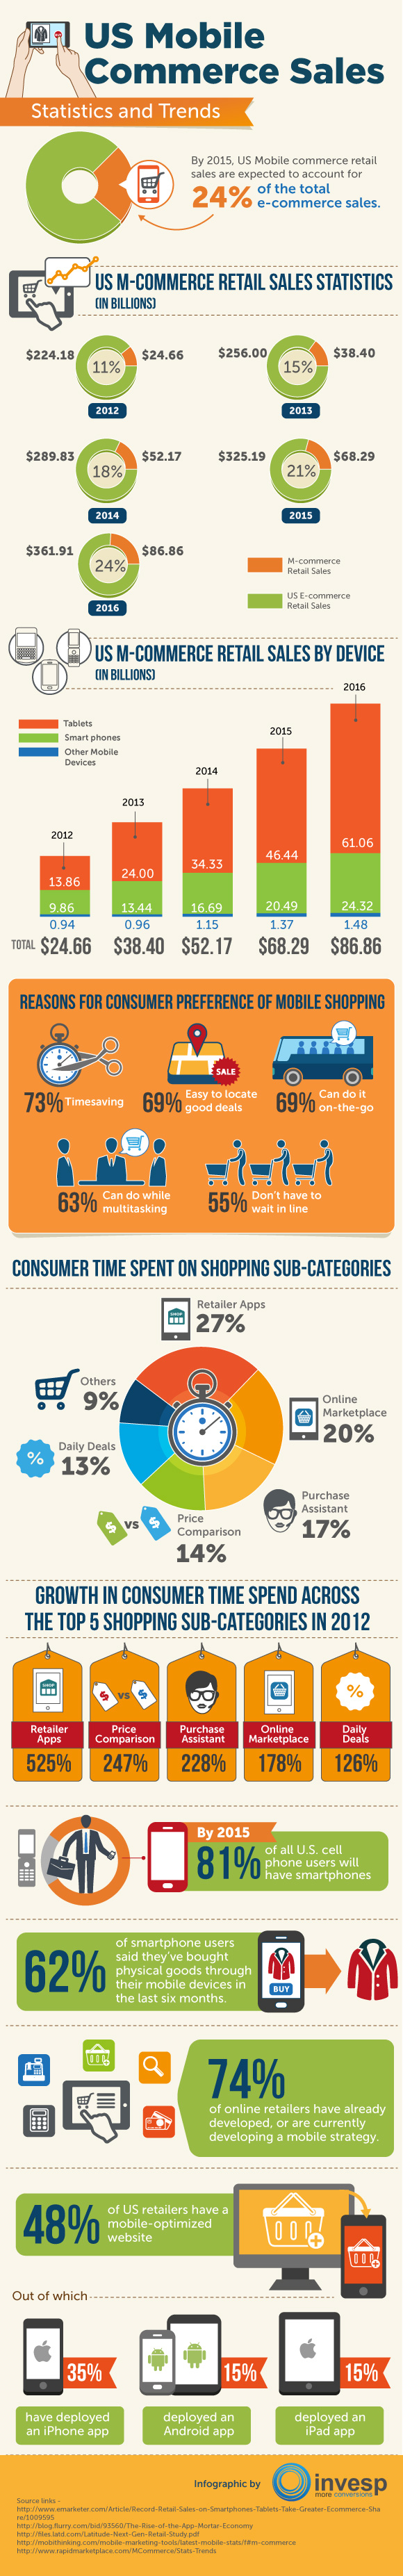
By 2015, US Mobile commerce retail sales are expected to account for 24% of the total e-commerce sales.
US M-commerce Retail Sales Statistics(In Billions)
| Year | M-commerce Retail Sales | US E-commerce Retail Sales | %Age Of Retail E-commerce Sales |
| 2012 | $24.66 | $224.18 | 11.0% |
| 2013 | $38.40 | $256.00 | 15.0% |
| 2014 | $52.17 | $289.83 | 18.0% |
| 2015 | $68.29 | $325.19 | 21.0% |
| 2016 | $86.86 | $361.91 | 24.0% |
US M-commerce Retail Sales by Device (In Billions)
| Devices | 2012 | 2013 | 2014 | 2015 | 2016 |
| Tablets | $13.86 | $24.00 | $34.33 | $46.44 | $61.06 |
| Smart phones | $9.86 | $13.44 | $16.69 | $20.49 | $24.32 |
| Other Mobile Devices | $0.94 | $0.96 | $1.15 | $1.37 | $1.48 |
Reasons For Consumer Preference Of Mobile Shopping
| Reason | %age |
| Timesaving | 73% |
| Easy to locate good deals | 69% |
| Can do it on-the-go | 69% |
| Can do while multitasking | 63% |
| Don’t have to wait in line | 55% |
Consumer Time Spent On Shopping Sub-categories
| Shopping Apps sub-category | %age of time spent |
| Retailer Apps | 27% |
| Online Marketplace | 20% |
| Purchase Assistant | 17% |
| Price Comparison | 14% |
| Daily Deals | 13% |
| Other | 9% |
Growth In Consumer Time Spend Across The Top 5 Shopping Sub-Categories In 2012
| Shopping Apps Sub-category | Growth In Time Spent |
| Retailer Apps | 525% |
| Price Comparison | 247% |
| Purchase Assistant | 228% |
| Online Marketplace | 178% |
| Daily Deals | 126% |
By 2015, 81% of all U.S. cell phone users will have smartphones.
62% of smartphone users said they’ve bought physical goods through their mobile devices in the last six months.
74% of online retailers have already developed, or are currently developing a mobile strategy.
48% of US retailers have a mobile-optimized website. Out of which, 35% have deployed an iPhone app, while 15% deployed an Android app and 15% deployed an iPad app.


